|
Projects DevelopedOver the last 20+ years we have developed several maptivists GIS projects. Some that we are most proud of are listed below.
 Toxic Release Inventory Reporting Facilities and Seismic Hazards - The recent nuclear catasrophe in Japan makes it crystal clear that nuclear facilities in seismic hazard zones are at high risk. Similarly, facilities in seismic hazard zones that store and use quantities of toxic chemicals are also at high risk to accidents resulting in environmental and human harm. Toxic Release Inventory Reporting Facilities and Seismic Hazards - The recent nuclear catasrophe in Japan makes it crystal clear that nuclear facilities in seismic hazard zones are at high risk. Similarly, facilities in seismic hazard zones that store and use quantities of toxic chemicals are also at high risk to accidents resulting in environmental and human harm.
 ToxicRisk.com: Toxic Chemical Facilities and Schools - ToxicRisk.com is a map-based website that enables users to investigate facilities listed in the EPA Toxic Release Inventory (TRI), number of schools within 1 mile and within 5 miles of the facility, plus links to a database about the toxic history of the facility. Users can also research a chemical to learn more about associated risks, and can find icons on the maps naming individual schools. ToxicRisk.com: Toxic Chemical Facilities and Schools - ToxicRisk.com is a map-based website that enables users to investigate facilities listed in the EPA Toxic Release Inventory (TRI), number of schools within 1 mile and within 5 miles of the facility, plus links to a database about the toxic history of the facility. Users can also research a chemical to learn more about associated risks, and can find icons on the maps naming individual schools.
 EPA Risk Management Plans (RMP) Search - These are the first Risk Management Plans that were submitted to EPA in 1999. EPA Risk Management Plans (RMP) Search - These are the first Risk Management Plans that were submitted to EPA in 1999.
Over the years we collected a good deal of information and reports about the Risk Management Plans, Offsite Consequence Analysis ("worst case scenarios") and the controversy over them - note that the "worst case scenarios" are still not readily available to the public (only available in federal reading rooms) and are not included in our database. In a nutshell, the argument has been that this information should not be publicly available because it will aid terrorists in their attempts to locate targets. We believe, as do many others, that it makes no difference if a chemical disaster occurs because of a terrorist act or a facility's accidental malfunction - the end result is the same - it is the onsite chemicals that are the threat and not the information about them. There is evidence that the publication of the Toxic Release Inventory (TRI) has resulted in the reduction of toxic chemical releases. If the public knows about the chemicals that are stored on site, it can take an active part in helping to reduce the risk. It is reasonable to assume that publication of the RMPs will have the same effect as the publication of the TRI data. There is much more to this story and related (and shelved) programs like EPA's Cumulative Exposure Project (CEP). Below is our archive of news and reports about Risk Management Plans and our Right-To-Know.
 The Arctic Wildlife Refuge Maps the Department of Interior Didn't Want You to See - These maps were created by a Department of Interior GIS technician, Ian Thomas. After being on the internet only a few days, they were removed and the technician was fired. Fortunately we were able to download this public U.S. government data before it was censored. You can read more about the issue here. The Arctic Wildlife Refuge Maps the Department of Interior Didn't Want You to See - These maps were created by a Department of Interior GIS technician, Ian Thomas. After being on the internet only a few days, they were removed and the technician was fired. Fortunately we were able to download this public U.S. government data before it was censored. You can read more about the issue here.
The maps describe Porcupine Caribou herd calving areas from 1983 to 1999. They show a high density calving area, and the extent of the calving area. The areas are based on locations of pregnant radio-collared cows. Collared cows were followed regularly during the calving season, and the first place a cow was seen with a calf was recorded as the calving location.
 Blue Creek Ah Pah Traditional Yurok Village: Maps of proposed Ah Pah Dam on the Klamath River and traditional Yurok territory - Decades ago the Ah Pah Dam was proposed to capture water in Northern California and send it to farms and communities in Southern California. The dam was not built, but if it had been built, it would have been 800 feet tall and would stop the flow of the Klamath River through the Yurok Reservation at Ah Pah, Thunder Mountain and Blue Creek creating a lake extending 108 miles upstream, flooding major parts of the Yurok Reservation, the Hupa Reservation and the lands of the Karuk Tribe. Blue Creek is a sacred place for North Coast Indians and it is the gateway to the High Country. It is also the site of the current Blue Creek Ah Pah Traditional Yurok Village. As California's thirst for water increases, someday they may once again come for the Klamath River. Blue Creek Ah Pah Traditional Yurok Village: Maps of proposed Ah Pah Dam on the Klamath River and traditional Yurok territory - Decades ago the Ah Pah Dam was proposed to capture water in Northern California and send it to farms and communities in Southern California. The dam was not built, but if it had been built, it would have been 800 feet tall and would stop the flow of the Klamath River through the Yurok Reservation at Ah Pah, Thunder Mountain and Blue Creek creating a lake extending 108 miles upstream, flooding major parts of the Yurok Reservation, the Hupa Reservation and the lands of the Karuk Tribe. Blue Creek is a sacred place for North Coast Indians and it is the gateway to the High Country. It is also the site of the current Blue Creek Ah Pah Traditional Yurok Village. As California's thirst for water increases, someday they may once again come for the Klamath River.
 MapCruzin.com - My son, Aran, and I developed this website in 1996. It is devoted to GIS (geographical information system). My mission in this work is to provide the information, tools, resources and expertise to enhance personal growth and knowledge and empower you in your efforts towards improving environmental and social conditions. We provide free GIS software, free maps, free GIS shapefile maps layers and a free Learn2Map GIS Tutorial and Atlas. Over the years the website has become quite popular serving on average 10,000+ pages per day. We also provide low cost federal and Indian lands and climate change shapefiles. MapCruzin.com - My son, Aran, and I developed this website in 1996. It is devoted to GIS (geographical information system). My mission in this work is to provide the information, tools, resources and expertise to enhance personal growth and knowledge and empower you in your efforts towards improving environmental and social conditions. We provide free GIS software, free maps, free GIS shapefile maps layers and a free Learn2Map GIS Tutorial and Atlas. Over the years the website has become quite popular serving on average 10,000+ pages per day. We also provide low cost federal and Indian lands and climate change shapefiles.
 Wireless Dangers: Radio Frequency Towers and Antennas - This is a very rough first draft, but I thought it was worth doing so that I could begin to grasp the spatial magnitude of wireless RF (Radio Frequency) towers and antennas. In the future, if there is interest, the maps themselves will be "zoomable." Also, in the future, the various types of antennas will be differentiated by color and style of icon and the icons themselves will be hittable so that a visitor can view information about each item on the map. I left most of the needed detail out of these maps to get a clear view of all the sites. Clearly, more zoom levels and street level mapping is needed. The data I used for these sites came from the FCC website. Wireless Dangers: Radio Frequency Towers and Antennas - This is a very rough first draft, but I thought it was worth doing so that I could begin to grasp the spatial magnitude of wireless RF (Radio Frequency) towers and antennas. In the future, if there is interest, the maps themselves will be "zoomable." Also, in the future, the various types of antennas will be differentiated by color and style of icon and the icons themselves will be hittable so that a visitor can view information about each item on the map. I left most of the needed detail out of these maps to get a clear view of all the sites. Clearly, more zoom levels and street level mapping is needed. The data I used for these sites came from the FCC website.
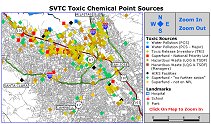 SVTC Toxic Chemical Point Sources - Interactive Web Maps showing the locations and providing information for hundreds of toxic chemical sources in seven categories. Geographic coverage includes Santa Cruz and Santa Clara counties and portions of San Mateo and Alameda counties. SVTC Toxic Chemical Point Sources - Interactive Web Maps showing the locations and providing information for hundreds of toxic chemical sources in seven categories. Geographic coverage includes Santa Cruz and Santa Clara counties and portions of San Mateo and Alameda counties.
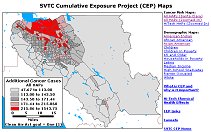 Cumulative Exposure Project (CEP) - A series of maps demonstrating concentrations of toxic chemicals in Santa Clara County hundreds of times more than the Clean Air Act (1990) goal of one additional cancer case in one million. The data indicates that an individual living in Santa Clara County has a cancer risk ranging from 47.67 to 1543.75 in one million (Note the goal above). Cumulative Exposure Project (CEP) - A series of maps demonstrating concentrations of toxic chemicals in Santa Clara County hundreds of times more than the Clean Air Act (1990) goal of one additional cancer case in one million. The data indicates that an individual living in Santa Clara County has a cancer risk ranging from 47.67 to 1543.75 in one million (Note the goal above).
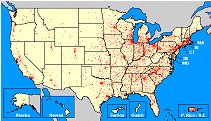 Environmental Defense Fund (EDF) Chemical Scorecard - (Note: The most current maps on the Chemical Scorecard were created in house by Environmental Defense. Shortly after we completed our Santa Cruz Toxic Release Inventory EDF contracted with us to create the interactive maps for their Chemical Scorecard project. We created the maps and data required for their launch with the 1995 TRI data and updated with 1996 maps and data a year later. Environmental Defense Fund (EDF) Chemical Scorecard - (Note: The most current maps on the Chemical Scorecard were created in house by Environmental Defense. Shortly after we completed our Santa Cruz Toxic Release Inventory EDF contracted with us to create the interactive maps for their Chemical Scorecard project. We created the maps and data required for their launch with the 1995 TRI data and updated with 1996 maps and data a year later.
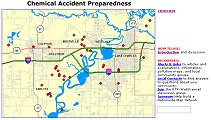 Pilot Risk Management Plan Maps - The Clean Air Act Amendments of 1990, required EPA to publish regulations and guidance for chemical accident prevention at facilities using extremely hazardous substances. Some 64,000 facilities around the U.S. were to submit their Risk Management Plans (RMPs) to the EPA by June 21, 1999. Only a portion of these have been submitted. Pilot Risk Management Plan Maps - The Clean Air Act Amendments of 1990, required EPA to publish regulations and guidance for chemical accident prevention at facilities using extremely hazardous substances. Some 64,000 facilities around the U.S. were to submit their Risk Management Plans (RMPs) to the EPA by June 21, 1999. Only a portion of these have been submitted.
There is concern that the Offsite Consequence Analysis (OCA) component of the RMP may be used by terrorists if published on the internet. This issue has resulted in a great deal of controversy. In response to this perceived threat, Congress decided that the risk of terrorist attacks was greater than that of non-terrorist related accidental releases, fire and explosion, and passed the Chemical Safety Information, Site Security and Fuels Regulatory Relief Act. On Aug. 5, 1999, President Clinton signed the act and it became law. The law prohibits "covered persons" from publishing the OCA on the internet with the exception of that portion of the OCA that is included in each facility's executive summary. Interestingly, the facilities themselves are not prohibited from publishing their OCAs and can do with them whatever they wish. EPA has issued a security notice about the distribution of the OCS portion of the RMP (in PDF format). If you intend to work with this data you should read the above law and EPA's notice. Note that none of the links to the EPA data are live at this time.
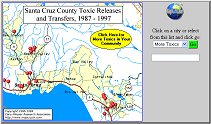 Santa Cruz Toxics Release Inventory: Our very first online project - The Santa Cruz TRI is an interactive map based resource for our community. It was the very first interactive map-based toxic chemical website in the U.S. It includes US EPA TRI releases and transfers. The Santa Cruz TRI also includes an extensive searchable right-to-know database and other resources central to communicating information about toxics. Santa Cruz Toxics Release Inventory: Our very first online project - The Santa Cruz TRI is an interactive map based resource for our community. It was the very first interactive map-based toxic chemical website in the U.S. It includes US EPA TRI releases and transfers. The Santa Cruz TRI also includes an extensive searchable right-to-know database and other resources central to communicating information about toxics.
History - Aran Deltac and Michael Meuser began developing the Santa Cruz Toxics Release Inventory. We did this for two reasons. We wanted to communicate information about toxics in our community and we wanted to provide a model that other communities could follow. Soon after EDF, after seeing our site, contracted with us to do the interactive maps of TRI facilities for the entire nation - the Chemical Scorecard. Our work on the Santa Cruz TRI has also lead to our working on several community-based projects. We host and maintain this website as a community service project.
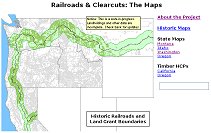 Railroads and Clearcuts - In the nineteenth century, the federal government directed several dozen railroad corporations to sell public lands along the tracks to homesteaders and settlers. The money raised was to be used to construct the nation's railroad and telegraph system. Congress blew it by giving the railroads much more land than they needed -- ten percent of the continental United States. The railroads, as corporations are wont to do, took full advantage of the situation. They sold millions of acres of the public domain to timber, mining, and real estate corporations, and kept millions of acres more for themselves. You can read other web pages to learn the history of the railroad land grants, or to learn about how Americans have recovered some of these grant lands in the past. Railroads and Clearcuts - In the nineteenth century, the federal government directed several dozen railroad corporations to sell public lands along the tracks to homesteaders and settlers. The money raised was to be used to construct the nation's railroad and telegraph system. Congress blew it by giving the railroads much more land than they needed -- ten percent of the continental United States. The railroads, as corporations are wont to do, took full advantage of the situation. They sold millions of acres of the public domain to timber, mining, and real estate corporations, and kept millions of acres more for themselves. You can read other web pages to learn the history of the railroad land grants, or to learn about how Americans have recovered some of these grant lands in the past.
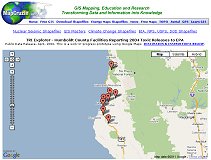 Humboldt County Toxic Releases - This is the bare beginnings of our exploration using Google Maps to display publicly available data. We cut our teeth doing this sort of mapping 15 years ago with our Santa Cruz Toxic Release Inventory - the very first of these sorts of maps in the U.S. This initial effort caught the attention of the Environmental Defense Fund and we were subsequently hired to do the first two years of the interactive maps for their Chemical Scorecard project. Humboldt County Toxic Releases - This is the bare beginnings of our exploration using Google Maps to display publicly available data. We cut our teeth doing this sort of mapping 15 years ago with our Santa Cruz Toxic Release Inventory - the very first of these sorts of maps in the U.S. This initial effort caught the attention of the Environmental Defense Fund and we were subsequently hired to do the first two years of the interactive maps for their Chemical Scorecard project.
Contact: [email protected] |
Blog Updates
 MapCruzin on Twitter
|

 This is a map of aboriginal Yurok territory is part of a set of